CUET Preparation Today
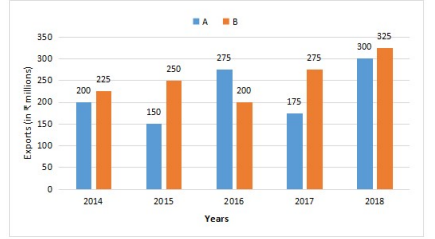
Study the given bar graph and answer the question that follows. The bar graph shows the exports of cars of types A and B (in ₹ million).
What is the ratio of the total exports of cars of type A in 2016 and 2018 to the total exports of cars of type B in 2015 and 2017? |
23 : 21 15 : 29 18 : 23 21 : 23 |
23 : 21 |
Total exports of cars of type A in 2016 and 2018 : Total exports of cars of type B in 2015 and 2017 ( 275 + 300 ) : ( 250 + 275 ) 575 : 525 23 : 21 |