CUET Preparation Today
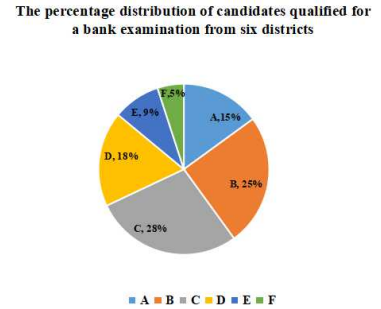
Study the given pie-chart and answer the question that follows. The pie-chart represents the percentage distribution of candidates qualified in a bank examination from six different districts of a State in 2016. The total number of qualified candidates from the State is 68000.
Out of the total selected candidates from Districts B and D, rural candidates are 60% and 40%, respectively. The number of selected urban candidates from B is what per cent (up to one decimal place) more/less than the number of selected urban candidates from D? |
Less, 7.4 More, 7.5 Less, 7.5 More, 7.4 |
Less, 7.4 |
Number of selected candidates in district B = \(\frac{25 }{100}\) × 68000 = 17000 Number of rural candidates in district B = \(\frac{60 }{100}\) × 17000 = \(\frac{3 }{5}\) × 17000 = 10200 Number of urban candidates = 17000 - 10200 = 6800 Number of selected candidates in district D = \(\frac{18 }{100}\) × 68000 = 12240 Number of rural candidates in district D = \(\frac{40 }{100}\) × 12240 = \(\frac{2 }{5}\) × 12240 = 4896 Number of urban candidates = 12240 - 4896 = 7344 Number of urban candidates in B is what percent less than number of candidates in D = \(\frac{7344 - 6800 }{7344}\) × 100 = 7.4% Ans :- Less , 7.4%
|