CUET Preparation Today
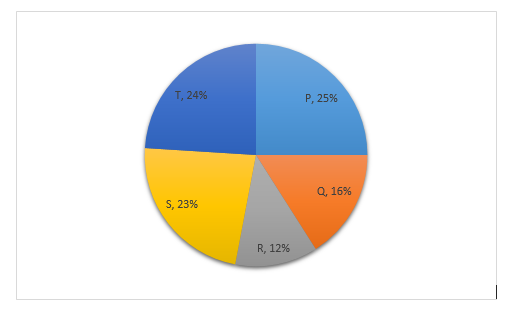
The pie-chart shows the percentage-wise distribution of the number of students in five different schools P, Q, R, S and T. The total number of students in all five schools is 10,500. Study the pie-chart and answer the question.
The number of students in schools R is what percent of the total number of students in schools Q and T together? |
30% 35% 25% 40% |
30% |
Number of students in school R = 12% Number of students in school Q and T = 16% + 24% = 40% Required percentage = \(\frac{12 }{40 }\) × 100 = 30% |