CUET Preparation Today
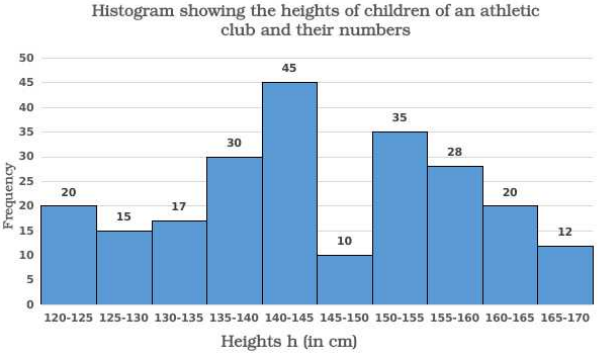
The given histogram shows the heights of 232 students of an athletic club and their numbers. Study the histogram carefully and answer the questions that follows.
If the histogram is to be presented by a line diagram, what would be the starting point and the end point of the line diagram? |
(122.5, 20) and (167.5, 20) (117.5, 0) and (172.5,0) (117.5, 20) and (172.5, 20) (122.5, 0) and (167.5, 0) |
(117.5, 0) and (172.5,0) |
We know , Mid point of class = \(\frac{Upper\; limit \;- \;Lower\; limit}{2}\) =\(\frac{125 - 120}{2}\) = 2.5 Starting point X - coordinate = 120 - 2.5 = 117.5 Y - coordinate = 0 End point X - coordinate = 170 + 2.5 = 172.5 Y - coordinate = 0 So , Starting points are ( 117.5 , 0 ) & ( 172.5 , 0 ) |