CUET Preparation Today
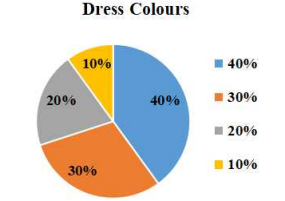
The following pie chart shows the different coloured dresses worn by 60 students in a college party. Study the pie chart and answer the question that follows.
The number of students who wore yellow coloured dress ( sector which represents 10%)is: |
20 10 6 12 |
6 |
Total number of students = 60 Number of students wore yellow dress = \(\frac{10 }{100}\) × 60 = 6 |