CUET Preparation Today
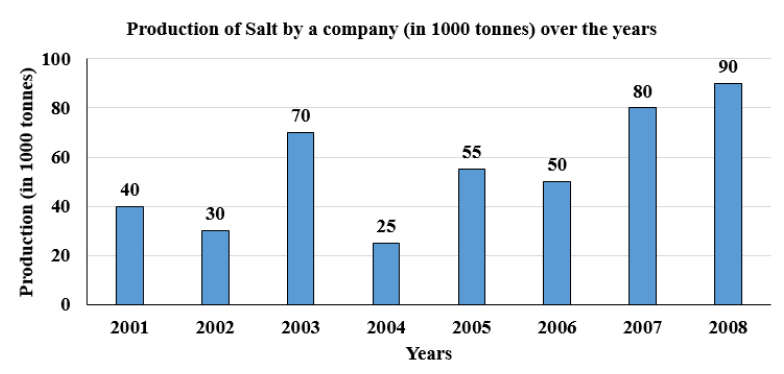
The given bar graph given below provides information about the quantity of salt produced by a company in 8 consecutive years. Study the information provided in the bar graph and answer the question that follows.
The average production of salt in 2001 and 2003 was exactly equal to the average production of salt in which of the following pairs of years? |
2006 and 2007 2001 and 2005 2002 and 2007 2005 and 2006 |
2002 and 2007 |
Average production of salt in 2001 & 2003 = \(\frac{40 + 70 }{2}\) = 55 Now , Lets solve one by one for each option . 1. 2006 & 2007 Average production of salt in 2006 & 2007 = \(\frac{50 + 80 }{2}\) = 65 2. 2001 & 2005 Average production of salt in 2001 & 2005 = \(\frac{40 + 55 }{2}\) = 47.5 3. 2002 & 2007 Average production of salt in 2002 & 2007 = \(\frac{30 + 80 }{2}\) = 55 4. 2005 & 2006 Average production of salt in 2005 & 2006 = \(\frac{55 + 50 }{2}\) = 52.5 So , Average production in 2002 & 2007 is same as average production in 2001 & 2003 .
|