CUET Preparation Today
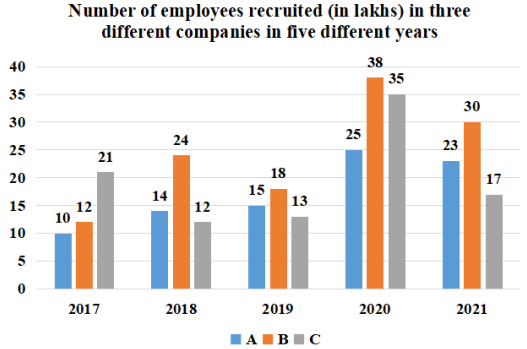
Study the given bar-graph and answer the question that follows. The bar-graph shows the number of employees recruited (in lakhs) by three different companies in five different years.
The number of employees recruited in company B in the year 2019 was what percentage of the number of employees recruited in company C in the year 2021(correct up to 2 decimal places)? |
88.85% 85.25% 105.88% 102.35% |
105.88% |
Required percentage = \(\frac{18}{17}\) × 100 = 105.88% |