CUET Preparation Today
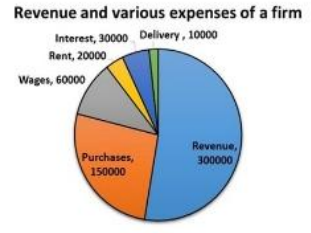
The Pie chart given below presents the projected revenue and various expenses for a firm for the previous financial year. If the profit margin for the upcoming financial year is projected at 20%, then by how much percentage will the margin change according to the projections?
|
50% decrease 50% increase 100% increase 75% increase |
100% increase |