CUET Preparation Today
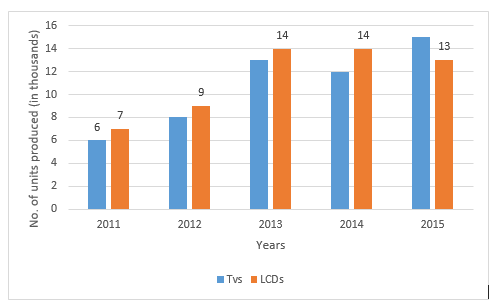
Study the following bar diagram and answer the question that follows. The production (in thousands) of electronic items (TV and LCD) in a factory during the period from 2011 to 2015.
The ratio of the total production of LCDs in the year 2012 and 2014 to the total production of TVs in th eyear 2012 and 2014 is: |
23 : 20 19 : 21 23 : 25 21 : 25 |
23 : 20 |
Total production of LCDs in the year 2012 and 2014 : Total production of TVs in the year 2012 and 2014 ( 9 + 14 ) : ( 8 + 12 ) 23 : 20 |