CUET Preparation Today
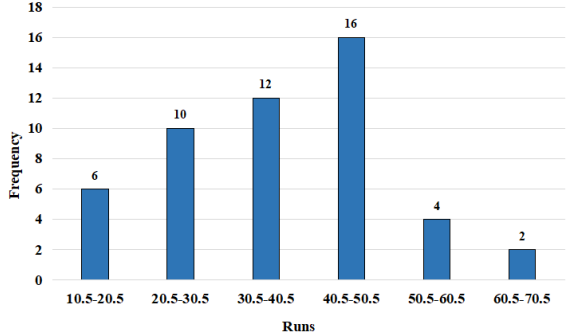
The histogram given below presents the frequency distribution of average runs scored by 50 selected players from a district in local cricket tournament. Study the histogram and answer the question that follows.
How many players scored 30.5 runs or less? |
28 34 12 16 |
16 |
Number of players scored less than 30.5 runs = 6 + 10 = 16 |