
CUETMOCK
  • Pricing
  • Mentors
Log inStart freeStart free mocks→

First test, then trust

Try a free CUET mock test.

Join 5,00,000+ students who rehearsed exam day on the exact NTA screen before sitting CUET. On the web and on Android.

Start free mocks →Get the Android app
CUETMOCK

India's #1 CUET Mock Test Platform. Original NCERT-based questions on the exact NTA exam screen — trusted by 5,00,000+ students since CUET 2022.

Get it onGoogle PlayScan to download the CUETMOCK app

Mock tests

  • CUET mock test series
  • Browse all papers
  • Commerce mocks
  • Humanities (Arts) mocks
  • Science mocks
  • Languages & GAT mocks
  • Free practice questions
  • Pricing

Resources

  • CUET exam guide
  • CUET syllabus
  • Universities accepting CUET
  • Expert blogs
  • News & notifications
  • Webinars & counselling
  • CUET score calculator
  • How we estimate your rank
  • FAQs

Company

  • About us
  • Our leadership & team
  • Our toppers
  • Mentors
  • For schools
  • Contact us
  • Terms
  • Privacy
  • Refund policy

Talk to us

+91 7696 6630 56info@cuetmock.comWhatsApp us

Our other platforms

  • JEE Mock — For IIT-JEE aspirants
  • NEET Mock — For NEET aspirants

Newsletter

Exam updates, study material and offers — no spam.

© 2026 NYC Ventures Pvt. Ltd.

701-702, Royal Business Park, Zirakpur, Punjab - 140603

  • Terms of use
  • Privacy policy
  • Refund policy
  • Contact us

iCUETMOCK is an independent preparation platform, not affiliated with the National Testing Agency (NTA). Always check exam details on the official NTA website.

  • Home
  • Mock tests
  • CUET guide
  • Pricing
  • Log in
Home/Practice questions/Economics
EconomicsMicro Economics: Non Competitive markets

Given below is the graph depicting cost and revenue curves of a monop…

Given below is the graph depicting cost and revenue curves of a monopolist firm.
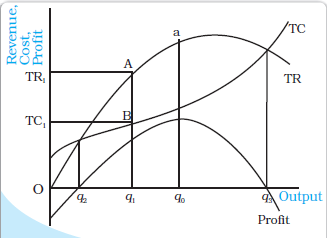
Out of the following output levels as shown in graph, maximum profit will be earned at?


Answer & explanation+

Correct answer: option 3

The profits are earned where total revenue is greater than total cost. At q2 and q3, total revenue is equal to total cost. So no profit no loss at these output levels. Between q1 and q0, more profit is earned at q0. So, out of output levels shown in graph, maximum profit is earned t q0.Also, profit will be maximum where distance between total revenue and total cost curves is maximum. This seems to happen at q0 level of output.

Advertisement

Practise more on Micro Economics: Non Competitive markets

Chapter-wise mocks on the real NTA exam screen, with solutions and your rank. Your first mocks are free.

Start free mocks →

Advertisement

Next questions

  1. In the context of proportions, what significance is highlighted in the painting?Fine Arts · The Bengal School and Cultural Nationalism
  2. Which concept comprises the following constructs: "a healthy body; high quality of personal relationships; a sense of purpose in life; self…Psychology · Meeting Life Challenges
  3. Select the correctly spelt word.English · Spelling Check
  4. Human development is based on the idea that ______ are integral to human well-being.Economics · Indian Economic Development: Human Capital Formation in India
  5. Match list I with list II LIST 1 LIST II A. Right to safety I. Freedom to access variety of products B. Right to be choose / assured II. Ge…Business Studies · Consumer Protection
  6. Which states are the leading producers of rice in descending order in India?Geography · India-People and Economy: Land resources and Agriculture
  7. Total Sales upon Number of Units Sold is the formula of:Entrepreneurship · Business Arithmetic
  8. Who wrote the book titled 'Gift to Monotheism'?General Aptitude Test · General Knowledge
  9. Fill in the blanks with the correct pair of words arranged sequentially:Physics ______ my weakest subject, but neither my tutor nor my pare…English · Grammar: Subject-Verb Agreement
  10. The rural settlements derive their life support or basic economic needs from _____.Geography · India-People and Economy: Human Settlements