CUET Preparation Today
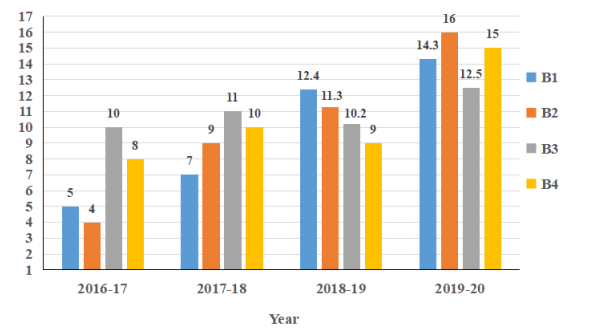
The given bar graph shows the sales (in thousands) of four mobile brands for four years. Study the graph and answer the question that follows.
If the sales of a brand is more than the average sales of these four brands in any year, then it gets a star. Which brand has the minimum number of stars from 2016 to 2019? |
B1 B3 B2 B4 |
B1 |
Number of stars in B1 from 2016 to 2019 = 5 + 7 + 12.4 + 14.3 = 38.7 Number of stars in B2 from 2016 to 2019 = 4 + 9 + 11.3 + 16 = 40.3 Number of stars in B3 from 2016 to 2019 = 10 + 11 + 10.2 + 12.5 = 43.7 Number of stars in B4 from 2016 to 2019 = 8 + 10 + 9 + 15 = 42 So , Number of stars are minimum in B1 from 2016 to 2019. |